You are here
Monsoon and Climate Change Threat in the Indian Ocean Region
Summary
The Indian Ocean, the world’s third largest, is warming at a faster rate than the other oceans, due to increased anthropogenic activities. This is leading to sea level rise and increase in frequency and intensity of extreme weather events as well as impacting key weather events like the monsoon in the Indian sub-continent. Despite geo-strategic contestation, collaboration in climate change studies can be non-contentious and has the potential to bring all the vulnerable nations in the Indian Ocean Region together for a common cause.
The Indian Ocean is the third largest ocean. It has an area of more than 70 million sq km with majority of littorals being developing countries. Around one-third of the world’s population resides in these countries which to a large extent are dependent on the ocean and its resources. The oceans and seas contribute immensely towards food security and poverty eradication. Worldwide, an increasing trend of leaning towards the oceans and seas is seen because of increasing population, depleting land resources and because the ocean and seas offer a sustainable growth option.
The concept of Blue Economy has gained traction worldwide due to its potential to provide food security, generate employment, build sustainable economic models, alleviate poverty, renewable energy source and fight climate change. The Blue Economy is estimated to be of more than a US$ 1.5 trillion per year globally and is likely to double to US$ 3 trillion by 2030 as per the Organisation for Economic Cooperation and Development (OECD).1 The OECD even considers oceans to be the next great economic frontier.
The World Bank has defined the Blue Economy as the “Sustainable use of ocean resources for economic growth, improved livelihoods, and jobs while preserving the health of ocean ecosystem”.2 Amongst the Sustainable Development Goals (SDGs) which form the core of United Nations 2030 Agenda for Sustainable Development and has been adopted by all UN member states in 2015, the SDG 14, “Life Below Water” is explicitly dedicated to the oceans while many other such as SDG 7, “Affordable and Clean Energy” are intrinsically linked to the oceans.3
Yet, the oceans are possibly facing greater threat than ever before due to the increased anthropogenic activities. Ocean acidification, ocean pollution, ocean warming, fishery collapse and eutrophication are all threatening the oceans and marine ecosystem because of which many nations are now vulnerable to natural or environmental disasters. The vulnerability increases manifold for the coastal populace or Small Island Developing States (SIDS).
The Indian Ocean is warming at a faster rate than the other oceans. The warming is leading to sea level rise and increase in frequency and intensity of extreme weather events, causing devastating floods and low-lying areas of nations losing their land areas.4 The situation in the Indian Ocean is going to be exacerbated by the existing events like ENSO and re-awakening of an ancient climate pattern, the Indian Ocean El-Nino due to the global warming which is fast approaching the tipping point.5
El-Nino Southern Oscillation (ENSO) and the Indian Ocean Dipole (IOD)
The primary cause of weather is differential heating between the land and ocean. Both land as well as the oceans have inherent properties which are quite dissimilar. While the land gets heated fast and cools fast, it is the oceans that have great potential to store heat and thus play a key role in influencing earth’s climate. This ability of oceans can be attributed to its large mass of around 1.35 x 10¹⁸ metric tonnes and high specific heat of water which is 4.186 J/gm deg C. Therefore, even a miniscule amount of temperature change in ocean water leads to huge change in heat energy. The observation and prediction about the trend and extent of variations in the Sea Surface Temperature (SST) especially in the tropical oceans is therefore key to assigning climate variability and extreme weather events.
Different oceans are known to exhibit different meteorological phenomenon. The Indian and Pacific Oceans are no exception to this. The driving of the global scale phenomenon such as El-Nino Southern Oscillation (ENSO) due to significant basin-wide Sea Surface Temperature Anomalies (SSTAs) and an ocean-atmosphere coupled interaction in the Pacific is well recognised. ENSO has the potential to influence global temperature and precipitations by changing global atmospheric circulation. It consists of warming and cooling phases in which the surface waters across the large region or band of the tropical Pacific Ocean becomes warmer or cooler by around 1°C to 3°C than the normal.6 The ENSO cycle consists of extreme phases, i.e., El Nino phase during which above-average Sea Surface Temperatures (SSTs) are observed in the central and eastern tropical Pacific Ocean, La Nina phase in which below-average (SSTs) are observed in the same region and the third phase called ENSO-neutral has the neutral conditions.
The Indian Ocean Dipole (IOD) is a climate phenomenon in the Indian Ocean (IO) sector of Walker Cell and is due to difference in SSTs between the Western and Eastern regions of Indian Ocean (IO). It is measured by the Dipole Mode Index (DMI) which is the difference between the SST anomalies of Western (10° S -10° N and 50° E – 70° E) and Eastern (10° S -0° N and 90° E – 110° E) equatorial Indian Ocean regions.
The neutral IOD is characterised by convective rains over Indonesia and dry weather in the Horn of Africa due to tropical high-pressure area. The positive phase of IOD is driven by warmer than normal SSTs off African coast and cooler than normal SSTs in the eastern Indian Ocean near Java and Sumatra. This results in reversing of the normal circulation and setting of easterly winds, suppressing convection over Indonesia, leading to dry weather and drought-like conditions. Whereas eastern Africa in the positive IOD phase receives higher than average rainfall leading to flood like situations.
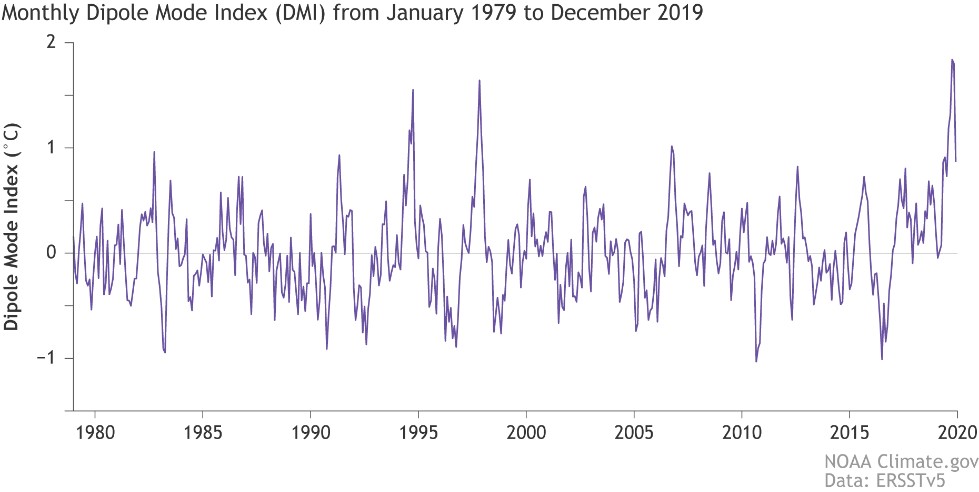
During the negative IOD phase, cooler than normal SSTs off the coast of Africa and warmer than normal SSTs off Indonesia are observed. The normal circulation therefore gets a boost with westerly winds getting more consistent and convection over Indonesia becoming stronger. This brings greater precipitation to the eastern IO and drought-like conditions for the Horn of Africa.7 The extreme positive IOD events such in 2019, which was one of the strongest warm Dipole years in last six decades, apart from bringing higher-than-average rainfall and floods in eastern Africa and drought in South-East Asia, also made substantial contribution in setting the stage for the devastating bush fires in the Australia.8 A monthly Dipole Mode Index (DMI) since January 1979 till 2019 is shown in Figure 1.

Source: “Meet ENSO’s Neighbour, the Indian Ocean Dipole”, Climate.gov, 27 February 2020.
The Indian Ocean (IO) is a tropical ocean and exhibits a dipole mode.9 The IO has been long considered to be a minor driver of climate variability when compared to Pacific or Atlantic. Due to the lack of equatorial upwelling and uniformly deep thermocline, IO exhibits comparatively much weaker SST variability, restricted to the western side of basin and along the coast of Sumatra and Java. However, recent scientific observations suggest that the mean state changes favouring stronger SST variations are now being experienced in the IO as well. These changes are long term and seem to be driven by the increased Green House Gas (GHG) concentrations.10
A dominant mode of SST variability in the IO has uniform warming of the entire basin and the IOD is second mode of variability in terms of SST variance. The intensity and spatial pattern of SST variations in the IO depends on the prevalent weak westerlies along the equator and the underlying subtle east-west SST gradient. The model simulations under high emission scenario have validated that increasing GHG can lead to altered mean state in the IO in the second half of this century. Past observations since 1950s too back the tendency for easterly winds along the equator, reversal of east-west SST gradient and an eastward shoaling thermocline.11 The research therefore is indicative that the Global warming could reawaken the Indian Ocean El Nino.12
Analysis of past climatic conditions existing during the Last Glacial Maximum (LGM), around 21,000 years ago through simulations also show that the IO then displayed similar altered mean state. These simulated changes in the IO are found to show El-Nino like variability. This altered mode manifests as cold and warm inter-annual events associated with large-scale SSTAs in the areas of Central and the Eastern Equatorial IO (EEIO).13
Indian Monsoon Patterns
The Southwest monsoon, which is spread over four months from June to September, is one of the most complex weather systems in the world. In the most simplistic terms, Southwest monsoon is a phenomenon where the South-easterly winds originating from Mascarene High in the southern hemisphere while crossing the Equator, gets deflected due to the Coriolis force, the trusted lieutenant of the monsoon at the equator and hence become South-westerly.
These winds while travelling over the vast sea area of the Indian Ocean for more than 4,500 km from its source pick up speed and moisture and on hitting the Western Ghats of India result in heavy rainfall. It advances northwards from southern India and over a period of nearly one and half month covers the entire country. The Heat Low formed over Northwest India and adjoining areas due to intense heating during the pre-monsoon or the summer season acts as a driving force for the whole process by creating the necessary pressure difference.
In India, monsoon means transition to rainy season from the hot and dry summer months.14 The normal date of monsoon onset over Kerala is 1 June. The onset of this much awaited annual weather event is forecasted based on daily rainfall over 14 stations in Kerala and the neighbouring areas, wind field and the Outgoing Longwave Radiation (OLR)15 and hence does not have a fixed date. At times the onset can be early, delayed or on time.
The advancement or withdrawal of monsoon also vary each year and this year-to-year variation is called as inter-annual variability of monsoon. The vagaries of monsoon are many and the non-interdependence of onset, advancement and withdrawal makes it one of the most studied and interesting weather events. In addition, monsoon systems such as monsoon lows, monsoon depressions, monsoon trough, offshore trough, mid-tropospheric circulations that keep forming, varying, moving and dissipating during these four months of the season ensures that the mystery and interest in monsoon stays throughout the season.
Analysis of the Southwest Monsoon 2023
The 2023 monsoon was no different in the terms of giving surprises and showing at times an unusual behaviour. It arrived on 19 May, three days ahead of its normal date in the south Andaman Sea and Nicobar Islands and got sluggish thereafter. With a week’s delay, it arrived over Kerala on 8 June. It picked up speed in between and covered the entire country by 2 July which is six days ahead of normal date.16
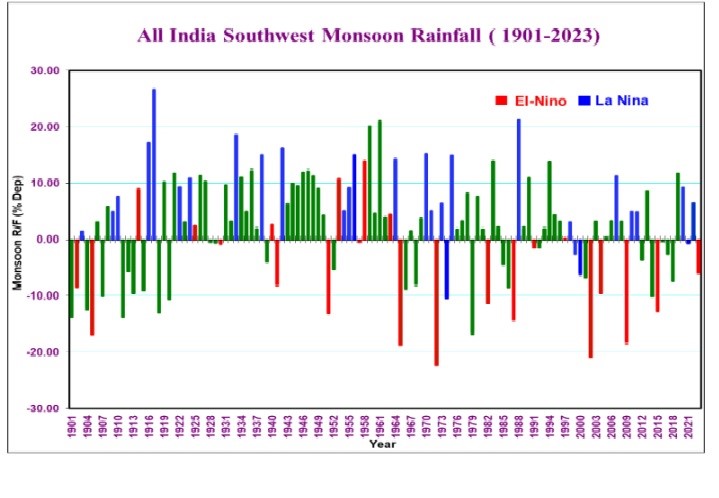
The IMD released the first stage forecast for the monsoon rainfall over the entire country on 11 April predicting monsoon rainfall to be 96 per cent of the Long Period Average (LPA) with a model error of ± 5 per cent.17 Subsequently, an updated Long Range Forecast Outlook came on 26 May 2023 stating that the rainfall during the Southwest monsoon for the year would be normal with 96 per cent of the LPA with a model error of ± 4 per cent.18 Generally, El Nino is considered to be notorious for suppressing monsoon rainfall over India and most of the El Nino years have been associated with drought conditions in the country. La-Nina years on the other hand are associated with above-average precipitation in India.
Figure 2 depicts the inter-annual variability of Southwest Monsoon season rainfall since the year 1901 under the influence of El-Nino Southern Oscillation (ENSO), a large-scale climate driver, having three phases i.e., El-Nino, La-Nina and the Neutral.

Source: “Monsoon Information”, India Meteorological Department, Ministry of Earth Sciences, Government of India
The IMD’s initial Monsoon Long Range Forecast (LRF) forecast through press release dated 11 April 2023 and updated LRF outlook on 26 May 2023 both reiterated that as per their Monsoon Mission Coupled Forecasting System (MMCFS) model and other global models, the El Nino conditions were likely to develop during the monsoon season. Further, the forecast also suggested that the existing neutral Indian Ocean Dipole (IOD) would turn positive in the Indian Ocean during the season negating or somewhat compensating for the El Nino effect.
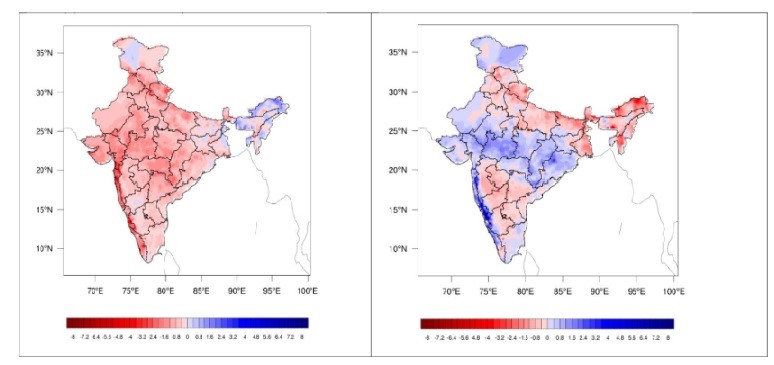
Generally, a positive IOD results in an above-average rainfall over India whereas a negative IOD is associated with below-average rainfall. The 2023 therefore was an interesting year which witnessed interplay between the El-Nino and IOD. While El-Nino influence was for a suppressed rainfall, the IOD during the latter phase was working other way round doing some offsetting and thus compensating for the deficiencies in the rainfall.
Figure 3 represents the rainfall anomaly composite during Southwest monsoon season for the past El-Nino events (left) and the rainfall anomaly composite during Southwest monsoon season for the past Positive IOD events (right).

Source: “Monsoon Information”, India Meteorological Department, Ministry of Earth Sciences, Government of India
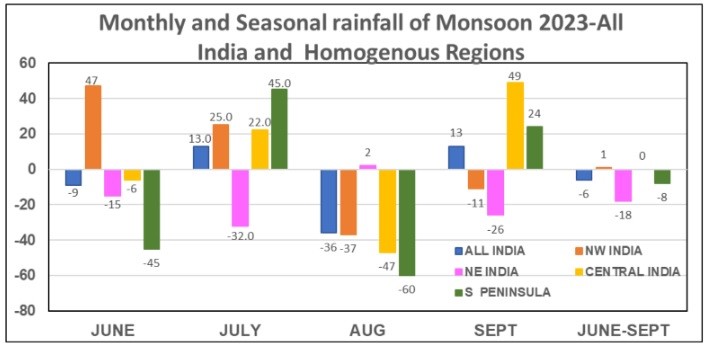
As the Southwest monsoon progressed, June 2023 received 91 per cent of LPA for the whole country. However, the heavy rainfall in July amounting to 113 per cent of LPA not only made up for the deficiencies but also resulted in excess rainfall of about +5 per cent near the month end.19 Fuelled by two break monsoon phases, an unfavourable Madden Julian Oscillation and the emergence of much feared El Nino conditions, August became the driest month in the past 122 years since 1901.20

Source: “Monsoon Information”, India Meteorological Department, Ministry of Earth Sciences, Government of India
The monsoon is technically considered to end as on 30 September and with September receiving 113 per cent of LPA rainfall, the total rainfall in the monsoon season 2023 amounted to 82 cm which is 94.4 per cent of LPA cumulative rainfall over the country.21 The monsoon rainfall between 94 per cent and 106 per cent of LPA is considered to be normal and hence monsoon season rainfall in 2023 was normal. This was 13th consecutive year that monsoon rainfall was in the category of normal.
The IMD therefore must be complemented for accurately predicting the onset, emergence of El Nino, IOD and the rainfall for monsoon season 2023. In fact, barring 2015, this was the 17th time since 2005 that the IMD forecast regarding the onset date of monsoon over Kerala have been proved to be correct.22
The withdrawal of Southwest monsoon 2023 started on 25 September after a delay of 8 days.23 The withdrawal process commences from extreme north-western India and 15 October is the normal date of monsoon withdrawal from southern peninsula and hence from the entire country. The deciding factors for monsoon withdrawal are cessation of rainfall activity for continuous five days over the area, formation of anticyclone in the lower troposphere and considerable reduction in moisture after 1 September from the Western parts of northwest India.24
Mitigating Climate Change Effects
The Indian economy is considered as a gamble of the Indian summer monsoon more commonly known as Southwest monsoon. The Long Period Average (LPA) of the monsoon rainfall is 86.86 cm25 which accounts for nearly 70 per cent of India’s annual rainfall. Being an agrarian society, almost half of India’s population either directly or indirectly depends on agriculture.26 A bad monsoon therefore invariably is disastrous for India’s agriculture and leads to inflation. Monsoon forecasting thus becomes a crucial input for the agriculture sector, farmers and water management agencies. However, the vagaries of monsoon and its unpredictability makes monsoon forecasting a daunting task despite unprecedented progress made in the field of observational techniques and forecasting models.
Cooperation is the key word amongst the Indian Ocean Region (IOR) countries. India’s policy is deeply rooted in its vision of SAGAR—Security And Growth for All in the Region. SAGAR, is a concept and vision, which provides India an opportunity to engage nations in the region in the fields of Atmospheric, Oceanic, Seismic and Hydrological sciences. India has all instruments, mechanisms and world-class institutes for building capabilities of littorals in the region. Such joint scientific studies align with one the five principles of SAGAR which states “Seeking a more integrated and cooperative future in the region to enhance sustainable development for all” and can raise the present level of cooperation and partnership in the region.27
The Bay of Bengal Initiative for Multi-Sectoral Technical and Economic Cooperation (BIMSTEC) is another platform which can be effectively utilised for cooperation in the field of atmospheric and oceanic studies. BIMSTEC, a regional organisation comprises seven member states—India, Bangladesh, Bhutan, Myanmar, Nepal, Sri Lanka and Thailand. All these nations are vulnerable to disasters triggered by the global warming in the Indian Ocean and also by the vagaries of the Southwest monsoon. BIMSTEC member nations hence must come together for collaboration and cooperation to undertake joint and multi-disciplinary scientific studies.28
The Indian Ocean Rim Association (IORA), an inter-governmental organisation aimed to strengthen regional cooperation and sustainable development is one more robust platform. The IORA has 23 member states and 11 Dialogue Partners. Moreover, it has representation of IOR nations which are likely to be impacted by climate change in the Indian Ocean.29 Being cognizant of the Blue Economy, the IORA adopted Blue Economy Declaration in September 2015 at Mauritius during its first Ministerial Blue Economy Conference (BEC). It has also established the Indian Ocean Blue Carbon Hub. The Hub based at Perth, Australia was officially announced in September 2019 for knowledge building and capacity enhancement to protect and restore blue carbon ecosystems throughout the Indian Ocean. It is aimed to reduce risks from natural disasters and climate change mitigation.30
The Indian Ocean Region is a vast expanse. The maritime trade route and Sea Lines of Communications (SLOCs) in the IOR, makes it a conduit of commerce connecting Middle East to Southeast and East Asia. The military presence of various countries near the choke points and maritime trade routes to protect the trade has grown over the years, making the region a key economic and strategic theatre. The region is as such mired with the challenges related to Non-traditional Security issues such as Piracy, Illegal, Unreported, and Unregulated (IUU) fishing, drug smuggling, human trafficking, etc., which impacts its security environment.
The geo-political, geo-economic and geo-strategic contestation is therefore a present-day reality in the IOR. Fragility in the IOR environment is a consequence of these complex issues and considerable presence of military presence. The collaboration and cooperation in climate change studies under the umbrella of SAGAR, BIMSTEC and IORA, is arguably the most non-contentious theme which has the potential to bring all the vulnerable nations together for a common cause. This would also help in building an atmosphere of trust and ease out the existing geo-strategic contestation in the region. The story of economic growth in the IOR can only be written on the canvas of peace and trust. The atmospheric and oceanic studies can be this vast common canvas.
Views expressed are of the author and do not necessarily reflect the views of the Manohar Parrikar IDSA or of the Government of India.
- 1. “What is the Blue Economy?”, The London School of Economics and Political Science, 16 May 2023.
- 2. “Blue Economy Definitions”, United Nations.
- 3. “The 17 Goals”, United Nations Department of Economic and Social Affairs.
- 4. “Climate Change ss the Biggest Threat to Indian Ocean Security”, The Diplomat, 31 August 2021.
- 5. “Climate Change Could Reawaken Indian Ocean El Nino”, Phys.org, 6 May 2020.
- 6. “What is ENSO?”, National Weather Service.
- 7. “What is the Indian Ocean Dipole?”, World Climate Service.
- 8. “Indian Ocean Dipole: What is it and why is it linked to floods and bushfires?”, BBC, 7 December 2019.
- 9. N.H. Saji et al., “A Dipole Mode in the Tropical Indian Ocean”, Nature, 23 September 1999.
- 10. P.N. Dinezio et al., “Emergence of an Equatorial Mode of Climate Variability in the Indian Ocean”, Science Advances, Vol. 6, No. 19.
- 11. Ibid.
- 12. “Climate Change Could Reawaken Indian Ocean El Nino”, n. 5.
- 13. P.N. Dinezio et al., “Emergence of an Equatorial Mode of Climate Variability in the Indian Ocean”, n. 10.
- 14. “Frequently Asked Questions (FAQs) on Monsoon”, India Meteorological Department, Ministry of Earth Sciences, Government of India.
- 15. Ibid.
- 16. “Monsoon Information: Progress of SW Monsoon”, India Meteorological Department, Ministry of Earth Sciences, Government of India.
- 17. “Long Range Forecast for the 2023 Southwest Monsoon Season Rainfall”, India Meteorological Department, Ministry of Earth Sciences, Government of India.
- 18. “Updated Long Range Forecast Outlook for the 2023Southwest Monsoon Season (June - September) Rainfall and Monthly Rainfall and Temperature for June 2023”, India Meteorological Department, Ministry of Earth Sciences, Government of India.
- 19. “Monsoon Information: End of Monsoon Season Report”, India Meteorological Department, Ministry of Earth Sciences, Government of India.
- 20. Amitabh Sinha, “Staring at Driest-ever August: Breaking Down El Nino Impact on the Monsoon”, Indian Express, 31 August 2023.
- 21. “Monsoon Information: End of Monsoon Season Report”, India Meteorological Department, Ministry of Earth Sciences, Government of India.
- 22. “Forecast of the Onset Date of Southwest Monsoon 2023 over Kerala”, India Meteorological Department, Ministry of Earth Sciences, Government of India.
- 23. “Southwest Monsoon has withdrawn from parts of southwest Rajasthan today, the 25th September, 2023”, India Meteorological Department, Ministry of Earth Sciences, Government of India.
- 24. “Frequently Asked Questions (FAQs) on Monsoon”, India Meteorological Department, Ministry of Earth Sciences, Government of India.
- 25. “Monsoon Information”, India Meteorological Department, Ministry of Earth Sciences, Government of India.
- 26. “Poor Monsoon Could Spell Disaster for India's Agriculture-based Economy, Say Experts”, The Economic Times, 19 June 2022.
- 27. “Unpacking SAGAR (Security and Growth for All in the Region)”, USI Occasional Paper, United Service Institution of India (USI), 2019.
- 28. “History”, Bay of Bengal Initiative for Multi-Sectoral Technical and Economic Cooperation (BIMSTEC).
- 29. “About IORA”, Indian Ocean Rim Association (IORA).
- 30. “Blue Economy”, Indian Ocean Rim Association (IORA).

