You are here
Interim Defence Budget 2019-20

 The interim Union Budget 2019-20, presented in Parliament on February 1, 2019, allocated Rs 4,31,011 crore (US$ 60.9 billion1) to the Ministry of Defence (MoD). Of the MoD’s total allocation, Rs 3,01,866 crore ($42.7 billion) is earmarked for what is conventionally termed as the defence budget. Though the interim allocation may change in the regular budget to be presented by the next government after the forthcoming parliamentary elections, it nonetheless provides a broad direction of the likely spending on national defence in the ensuing fiscal year. This Issue Brief examines India’s latest defence allocation. In so doing, it also looks at five year trends in defence allocation, key growth drivers, share of the armed forces, impact on modernisation and progress achieved on the ‘Make in India’ initiative in defence manufacturing. The Brief begins with a broad survey of India’s macro economy and fiscal situation, which have a direct bearing on defence.
Macroeconomic Scenario
Despite higher crude oil prices, rising global trade tensions and a stressed domestic banking system, the economy is poised to grow at 7.2 per cent in real terms in 2018-19, the fastest among the world’s large economies. The growth forecast in the medium-term also looks bright, in the light of structural reforms undertaken in the recent past, revival of investment rate, stability in exchange rate and decline in global crude oil prices. The nominal gross domestic product (GDP) is forecast to grow at 11.5 per cent in 2019-20 and at over 12 per cent in the next two years. The robust growth forecasts also come in the wake of the significant improvements in several macro-economic indicators such as the low inflation rate of 3.7 per cent in April-December 2018 and progressively narrowing fiscal and current account deficits.
Though India’s macro economy remains relatively healthy, fiscal consolidation has not progressed as planned. The fiscal deficit2 in 2019-20 is budgeted at 3.4 per cent of GDP as against 3.2 per cent envisaged in the previous budget. The expansionary fiscal policy, which is not uncommon in a pre-election budget, is largely aimed at addressing agrarian distress and meeting the aspirations of the common man. However, the provision of Rs 75,000 crore for assured income support at the rate of Rs 6,000 per year to 12 crore farmers, tax exemption for income up to Rs 5,00,000, a new pension scheme for the unorganised sector, and a host of other ‘populist’ initiatives have eaten up much of the fiscal space in the 2019-20 budget, even though the government’s total expenditure has shot up by 14 per cent.
With limited fiscal space available, the defence budget has been subject to a moderate increase of a little over eight per cent. This hike would not, however, satisfy the MoD, which is already grappling with a huge shortage of resources to meet its expenses. In 2018-19, the shortage of funds for the three services alone amounted to 30 per cent – or Rs 1,12,137 crore – against a projected requirement of Rs 3,71,023 crore. What is of greater concern for the MoD is that this shortage is unlikely to be bridged in the next few budgets. With the recurring effects of many of the promised ‘populist’ measures continuing into future budgets, and a tight fiscal path the government has articulated (by which the fiscal deficit is planned to be contained at three per cent of GDP from 2020-21 onwards), the scope for a hefty increase in defence expenditure in the medium-term looks grim.
MoD Budget: Civil and Defence
Of the Rs 4,31,011 crore allocated to the MoD, the defence budget accounts for 70 per cent. The balance 30 per cent is earmarked for MoD’s civil expenditure, which consists of MoD (Miscellaneous) and defence pension (Table 1). Owing to the implementation of the 7th Central Pay Commission recommendations and Rs 35,000 crore spent on account of the One Rank One Pension (OROP) scheme, the pension budget has seen the highest percentage increase among the three major components of the MoD’s expenditure. To put this in perspective, between 2015-16 and 2019-20, the growth in defence pension has been 86 per cent, in comparison to the 50 per cent and 47 per cent rise in defence expenditure and MoD’s overall expenditure, respectively. Pension’s higher growth has increased its share in the MoD’s expenditure from one-fifth to over a quarter now. In the same time period, pension alone has also contributed 38 per cent to the overall growth in the MoD’s expenditure.
| Year |
Civil Expenditure (Rs in Crore) |
Defence Expenditure (Rs in Crore) |
MoD’s Expenditure (Rs in Crore) |
Defence Pension as % of MoD Expenditure |
|
|
Pension |
MoD (Misc.) |
||||
|
1 |
2 |
3 |
4 (1+2+3) |
5 (1/4*100) |
|
| 2015-16 |
60238 |
32267 |
201415 |
293920 |
20 |
| 2016-17 |
87826 |
15014 |
248710 |
351550 |
25 |
| 2017-18 |
92000 |
15145 |
272560 |
379704 |
24 |
| 2018-19 (BE) |
108853 |
16206 |
279305 |
404364 |
27 |
| 2018-19 (RE) |
106775 |
16318 |
282100 |
405194 |
26 |
| 2019-20 (BE) |
112080 |
17065 |
301866 |
431011 |
26 |
Note: MoD (Miscellaneous) includes MoD Secretariat, Defence Accounts Department, Canteen Stores Department, Defence Estates Organization, Coast Guard Organisation, JAKLI, Border Roads Organisation, Military Firms ad Ex-Servicemen Health Scheme, etc.; Rs 1.0 crore = Rs 10 million = US$ 141,377 (alternatively, US$ 1.0 million = Rs 7.1 crore) as per the average exchange rate of January 2019.
Budget and Revised Estimates and Key Growth Driver
Table 2 compares the interim defence allocation with the budget estimates (BE) and revised estimates (RE) of 2018-19. The interim allocation has increased over both BE and RE of 2018-19, though there has been a little difference in the growth percentages owing to marginal increase in the 2018-19 RE. Between revenue and capital segments, though the former has increased more in percentage terms, the latter dominates the overall growth in defence allocations. Of the total growth of Rs 22,561 crore in the interim allocation over the 2018-19 BE, revenue expenditure contributes 58 per cent (or Rs 13,163 crore), and the balance 42 per cent (Rs 9,398 crore) is contributed by the capital expenditure. The key driver of revenue growth has been the manpower cost of the three services. It has contributed 42 per cent to the revenue expenditure growth and 25 per cent to the total defence budget growth. Within capital expenditure, the acquisition budget has been the main growth factor. Its contribution to the growth in capital expenditure and overall defence budget is 78 and 32 per cent, respectively.
|
Revenue Expenditure |
Capital Expenditure |
Total |
|
| 2018-19 (BE) (Rs in Crore) |
185323 |
93982 |
279305 |
| 2018-19 (RE) (Rs in Crore) |
188118 |
93982 |
282100 |
| 2019-20 (BE) (Rs in Crore) |
198486 |
103380 |
301866 |
| % Growth in 2019-20 (BE) over 2018-19 (RE) |
6 |
10 |
7 |
| % Growth in 2019-20 (BE) over 2018-19 (BE) |
7 |
10 |
8 |
Key Defence Statistical Parameters
Table 3 provides key defence budget and related statistical parameters for 2018-19 and 2019-20. While some parameters — growth in defence budget, capital expenditure and modernisation budget — have improved, others, particularly the shares of defence allocation in GDP and central government expenditure (CGE), have declined. The revenue-capital ratio and share of capital segment of the defence budget in total central government capital expenditure has remained at the same level.
| Parameter | 2018-19 | 2019-20 |
| Defence Budget (Rs in Crore) | 2,79,305 | 3,01,866 |
| Growth of Defence Budget (%) | 7.7 | 8.1 |
| Revenue Expenditure (Rs in Crore) | 1,85,323 | 1,98,486 |
| Growth of Revenue Expenditure (%) | 7.3 | 7.1 |
| Share of Revenue Expenditure in Defence Budget (%) | 66 | 66 |
| Capital Expenditure (Rs in Crore) | 93,982 | 1,03,380 |
| Growth of Capital Expenditure (%) | 8.7 | 10.0 |
| Share of Capital Expenditure in Defence Budget (%) | 34 | 34 |
| Share of Capital Expenditure in Central Government Capital Expenditure (%) # | 31 | 31 |
| Capital Acquisition (Rs in Crore) | 74,116 | 81,422* |
| Growth of Capital Acquisition (%) | 6.7 | 9.9* |
| Share of Defence Budget in GDP (%) | 1.48 | 1.44 |
| Share of Defence Budget in Central Government Expenditure (%) | 11.4 | 10.8 |
| Defence Pension (Rs in Crore) | 1,08,853 | 1,12,080 |
| Growth of Defence Pension (%) | 27 | 3.0 |
| MoD’s Budget (Rs in Crore) | 4,04,365 | 4,31,011 |
| Growth in MoD’s Budget (%) | 12.4 | 6.6 |
| Share of MoD Budget in GDP (%) | 2.2 | 2.1 |
| Share of MoD Budget in Central Government Expenditure (%) | 16.6 | 15.5 |
Note: *: Approximate estimates; #: The share is with respect to the capital segment of the defence budget. If the MoD’s total capital expenditure is taken into accounts, the share increases to 32.2 per cent in 2019-20.
Share of Defence Services
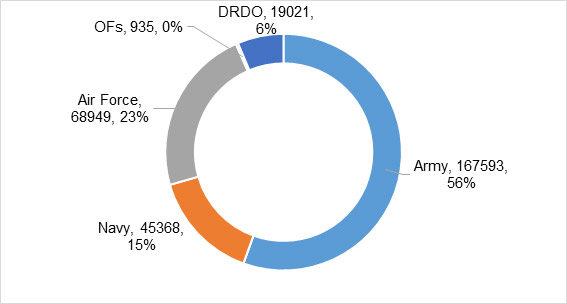
Like in the past, the Army has the dominant share in the latest defence allocation, though it is the least capital intensive service among the three services (Figure 1 and Table 4). The Army’s predominant share in the defence budget is due to its overwhelming numerical superiority. Accounting for 86 per cent of total uniformed personnel (of 1.4 million as of 2017), the bulk of its budget is spent on Pay and Allowances (P&A). In the 2019-20 budget, the Army’s P&A accounts for 69 per cent of its revenue budget and 57 per cent of its overall budget.
Note: Army includes Directorate General Quality Assurance (DGQA)
| Army | Navy | Air Force | |
| Revenue Expenditure (Rs in Crore) | 138085 | 22212 | 29602 |
| Capital Expenditure (Rs in Crore) | 29508* | 23156 | 39347 |
| Total (Revenue and Capital) (Rs in Crore) | 167593 | 45368 | 68949 |
| Revenue Expenditure as % of Total | 82 | 49 | 43 |
| Capital Expenditure as % of Total | 18 | 51 | 57 |
Note: *: Includes Rs 10.96 crore for capital expenditure of DGQA
Modernisation
Table 5 summarises the modernisation budgets of the three services for 2018-19 and 2019-20 and Tables 6, 7 and 8 provide their broad distribution under various acquisition heads. The latest allocation for modernisation has not only grown over previous outlays, but the previous year’s allocation has also been marginally over-utilised at the RE stage. The over-utilisation is, however, due to over-spending by the Air Force and the Navy, with the Army having marginally under-spent its portion of the capital budget. The Army’s under-utilisation, however small, does not augur well, especially when its modernisation requirements are very high.
Though the growth of nearly 10 per cent (Rs 7,198 crore) in capital acquisition outlays provided in the interim budget looks healthier, it is unlikely to satisfy the vast modernisation requirements of the armed forces. This is more so given that the previous allocation was not even sufficient to meet the committed liabilities (CL) or to pay for signed contracts. To put this in perspective, in 2018-19, as against Rs 1,10,044 crore required for CL, the total allocation for modernisation — which includes, besides CL, New Schemes for signing fresh contracts — was Rs 74,116, leaving a gap of Rs 35,928 crore or 33 per cent. Against this shortage, the increase of a mere Rs 7,198 crore is only going to compound the problem for the MoD which would be in an extremely difficult situation to prioritise its payments for both previously signed contracts and the contracts to be signed till the end of 2019-20. It is pertinent to note that in the first nine months of 2018-19, the MoD has already signed contracts worth more than Rs 60,000 crore. These include the S-400 Triumf (Russia: Rs 40,000 crore), P1135.6 Frigates (Russia: Rs 6,679 crore), Air Defence Fire Control Radar (Israel: Rs 4577 crore), Diving Support Vessels (Hindustan Shipyard: Rs 2,494 crore) and Survey Vessels Large (Garden Reach Shipbuilders and Engineers: Rs 2435 crore). Assuming 15 per cent payment in a year, the total requirement would amount to over Rs 9,000 crore. Needless to mention, the extra modernisation funds in the interim budget is inadequate.
| 2018-19 (BE) | 2018-19 (RE) | 2019-20 (BE) | % Increase in 2019-20(BE) over 2018-19 (BE) | |
| Army* | 21211 | 21166 | 22951 | 8.2 |
| Navy | 19927 | 20035 | 22106 | 10.9 |
| Air Force | 33085 | 33100 | 36365 | 9.9 |
| Total | 74224 | 74301 | 81422 | 9.7 |
Note: *: Figures for Army are approximate
| Modernisation Head | 2018-19 (BE) | 2018-19 (RE) | 2019-20 (BE) | % Increase in 2019-20(BE) over 2018-19(BE) |
| Aircraft & Aero-Engine | 1813 | 2369 | 2115 | 16.7 |
| H&MV | 1972 | 1732 | 2128 | 7.9 |
| Other Equipment | 17198 | 16993 | 18562 | 7.9 |
| Rolling Stock | 128 | 2 | 50 | -61.0 |
| Rashtriya Rifles | 100 | 70 | 95 | -4.7 |
Note: *: Figures for Army are approximate
| Modernisation Head | 2018-19 (BE) | 2018-19 (RE) | 2019-20 (BE) | % Increase in 2019-20 (BE) over 2018-19 (BE) |
| Aircraft & Aero-Engine | 1900 | 1900 | 2400 | 26.3 |
| H&MV | 20 | 60 | 45 | 125.0 |
| Other Equipment | 4863 | 3470 | 3500 | -28.0 |
| Joint Staff | 844 | 887 | 929 | 10.0 |
| Naval Fleet | 10300 | 11313 | 12182 | 18.3 |
| Naval Dockyard/Projects | 2000 | 2405 | 3050 | 52.5 |
| Modernisation Head | 2018-19 (BE) | 2018-19 (RE) | 2019-20 (BE) | % Increase in 2019-20 (BE) over 2018-19 (BE) |
| Aircraft & Aero-Engine | 24709 | 24812 | 24807 | 0.4 |
| H&MV | 202 | 66 | 110 | -45.6 |
| Other Equipment | 8174 | 8223 | 11448 | 40.1 |
Make in India
Since the launch of the ‘Make in India’ initiative in 2014, the MoD has undertaken a host of initiatives to promote indigenous defence manufacturing. These initiatives pertain to the defence procurement process, industrial licensing, foreign direct investment, exports and innovation. Further capitalising on these initiatives, the MoD, during the past year, has also announced the setting up of two defence industrial corridors — one each in Uttar Pradesh and Tamil Nadu — and promulgated a draft defence production policy that aims at increasing defence production to Rs 1,70,000 crore by 2025. While these initiatives have largely been welcomed by the industry, one crucial initiative that has not taken off pertains to ‘Make’ projects, the procedures of which have been simplified several times in the recent past. Even the paltry sum of Rs 142 crore earmarked for these projects in the 2018-19 budget has largely remained underutilised. Moreover, the allocation under this head in the new budget has been reduced to Rs 95 crore, indicating much less emphasis on these projects which are key to integrating local companies, especially the small and medium ones from the private sector, into defence production.
Conclusion
An eight per cent increase in the defence budget is bound to further intensify the resource problem of the MoD, which is already battling a massive shortage of funds. However, given the election year and the ‘populist’ context of the interim budget, any substantial increase in the defence budget would have been difficult. What is of greater concern for the MoD is that its budget outlook in the medium term also looks grim in view of the recurring effects of the various benefits announced in the budget and the tight fiscal consolidation path that the government has laid down. Given this stark reality, the defence establishment has very little option but to optimise its expenses.
Views expressed are of the author and do not necessarily reflect the views of the IDSA or of the Government of India.
Download Complete [PDF]
- 1. Conversion to US$ is based on average exchange rate ($1.0 = Rs 70.7) of January 2019.
- 2. Fiscal Deficit is excess of government expenditure over non-borrowing receipts. It reflects the total borrowings of the government to meet its expenses. In absolute terms, the Fiscal Deficit amounts to Rs 7,03,999 crore in the 2019-20 interim budget.