You are here
Estimating India’s Defence Manpower


 Summary: This issue brief estimates MoD's manpower strength in the armed forces and various other defence establishments. It also estimates total defence manpower cost, and, in so doing, looks at uniformed and civilian pay and allowances. The brief argues that like other matured democracies, such as the US and the UK, India also needs to have a public version of a manpower database which could be part of its annual budgetary document. This would facilitate greater understanding and analysis of any possible manpower-related reforms in the future.
The Ministry of Defence (MoD) employs the biggest workforce among all the central government ministries. Its workforce is nearly 50 per cent larger than that of the Railways and over 90 per cent higher than that of the Home Affairs – the two most manpower-intensive ministries after the MoD.1 Though the bulk of the MoD’s workforce consists of uniformed personnel (employed in the army, navy and air force), a sizeable number of defence civilians are employed in the armed forces and various other establishments to perform a variety of functions ranging from the provision of clerical support to the design and manufacture of state-of-the-art weapon systems. Naturally, pay and pension constitute the single largest element of the MoD’s expenditure.2
The MoD does not, however, provide regular updates on the number of personnel in its roll in any systematic manner. It is, therefore, logical to assume that MoD does not have a centralised database of its manpower or, if it has, it does not wish to place it in the public domain for unspecified reasons. Nevertheless, it has been estimated previously that MoD pays nearly 50,72,880 people from its annual budget and that these personnel are spread across three broad categories: uniformed personnel, defence civilian employees, and defence pensioners.3
How accurate is the abovementioned estimate and does it capture all the MoD’s serving and retired personnel? This issue brief attempts to answer this question by identifying the number of personnel in different categories including those who are paid outside the MoD’s budget. In so doing, it also examines total personnel cost of defence manpower, the share of uniformed and civilian personnel in total pay and allowances (P&A), and the distribution of the uniformed personnel’s P&A among various budgetary heads. It is intended to sensitise policymakers about the imperative of manpower reforms, in view of several demands for rationalising defence manpower cost.
Among the influential voices, the Chief of Defence Staff (CDS), appointed recently as part of the Narendra Modi Government’s higher defence management reform, has advocated containing the defence manpower cost.4 The CDS’ view assumes greater significance considering that the Indian defence budget is increasingly being consumed by rising manpower cost, leaving very little for modernisation, upkeep of existing arms in inventory, infrastructure upgradation, and research and development (R&D).5
Defence Manpower Data
Major democracies have developed a transparent system of mapping their defence manpower in a systematic manner. For instance, the United States (US) Department of Defense (DoD) provides time-series workforce data dating back to 1940 as part of its annual budget document. It is provided in two broad categories – active duty military and civilians – with details given in a number of sub-categories (active duty military: army, navy, marine corps, air force; civilians: army, navy and marine corps, air force, space force and defence agencies).6 For military retirees, time-series data from 1960 onwards are provided by DoD’s Office of the Actuary.7 Apart from this, the US Department of Veterans Affairs maintains a comprehensive database, providing the number and expenditure details of veterans since at least the late 1990s.8
The United Kingdom (UK) also provides key manpower data as part of its various official publications. The UK MoD publishes regular statistics on armed forces personnel strength, annual intake and outflows, and the strength of civilian employees.9 Data on pensioners are provided in two separate documents. The annual statistical document on War Pension Scheme provides the number of beneficiaries and pension expenses on account of illness/injury/death caused to service personnel between World War I and April 2005.10 For the armed forces pensioners, post-April 2005, the number and expenditure details are presented to the UK Parliament in the form of annual accounts.11
It is important to note that the statistical reports published by the US and the UK are not just an exercise in itself; rather, they serve the larger interest of manpower management. In both countries, the data on active duty military personnel are used to estimate the future pension liability of the serving members.
Unlike in the US or the UK, India does not have a system of regularly reporting defence manpower in its entirety. The only exception to this is manpower figures pertaining to defence civilians. As part of its annual exercise in estimating the expenditure on P&A of central government civilian employees, the Ministry of Finance (MoF) reports authorised and held strength of various central government ministries and departments since 2000-01.12 As of 2017-18, the latest year for which details are available, there are 3,98,422 defence civilians against a sanctioned strength of 5,85,476 – a shortage of 32 per cent. Of the total held strength of defence civilian employees, four per cent (17,160) are in Group ‘A’ service, 15 per cent (59,415) in Group ‘B’ and 81 per cent (321,847) in Group ‘C’.13
The MoF figures of defence civilians, however, need to be read with caution as the reported numbers exhibit an element of arbitrariness. As shown in Figure 1, both the sanctioned and held strength of defence civilians remain constant to the last digit of the numbers for several years, raising doubts about the existence of a proper mechanism for reporting these figures.
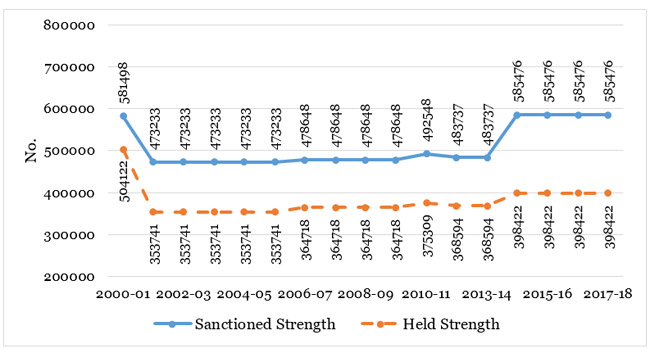
Note: Figures for 2011-12 are not available.
Source: Compiled from Annual Report on Pay and Allowances (relevant years), Department of Expenditure, Ministry of Finance, Government of India.
As regards uniformed personnel, sporadic details are available in various reports of the Parliamentary Standing Committee on Defence which, from time to time, enquires about the status of manpower in the armed forces and some other defence establishments. As of 2019, the strength of uniformed personnel in the three services totals 14,38,717 against a sanctioned strength of 15,15,878, representing a shortage of five per cent. Of the total number of uniformed personnel, the army accounts for about 85 per cent, distantly followed by the air force with 10 per cent and the navy with five per cent. The officer cadre of the three forces accounts for about five per cent of the total number of uniformed personnel (see Table 1). It is, however, to be noted that even though the officer cadre is a minuscule part of the total personnel strength of the armed forces, in absolute numbers there has been a significant increase, from about 15,300 in 1957 to 37,900 in 1967 and 53,615 in 2007.14 During 2007-19, the number of officers has increased by 23 per cent.
Service |
Category | No. | % of Total |
|
Army
|
Officers
|
42,913 | 3.0 |
|
Personnel Below Officer Rank (PBOR)
|
11,85,146 | 82.4 | |
|
Total
|
12,28,059 | 85.4 | |
|
Navy
|
Officers
|
10,979 | 0.8 |
|
Sailors
|
58,073 | 4.0 | |
|
Total
|
69,052 | 4.8 | |
|
Air Force
|
Officers
|
12,159 | 0.8 |
|
Airmen
|
1,29,447 | 9.0 | |
|
Total
|
1,41,606 | 9.8 | |
|
Total Officers
|
66,051 | 4.6 | |
|
Total Others
|
13,72,666 | 95.4 | |
|
Total (Officers and Others)
|
14,38,717 | 100.0 | |
Source: Compiled from “Demands for Grants (2019-20)”, SCOD (2019-20), 17th Lok Sabha, 2nd Report, Lok Sabha Secretariat, December 2019.
It is important to note that the number of uniformed personnel as reported in Table 1 does not include four elements which are an integral part of the armed forces. These are: (1) officers deployed in the Army Medical Corps (AMC), Army Dental Corps (ADC) and Military Nursing Service (MNS); (2) personnel serving in the Defence Security Corps (DSC);15 (3) Non-Combatants Enrolled (NCs (E)) of the air force; and, (4) new military recruits undergoing training. These elements together account for over 1,60,000 personnel (see Table 2).
In comparison to defence civilians and uniformed personnel, information on defence pensioners is rather limited. It is only recently that the Standing Committee on Defence has reported some broad details of pensioners. Of the total number of defence pensioners (of 32,35,730), 81 per cent (26,33,947) are military retirees or their dependents and 19 per cent (6,01,783) are defence civilians. The latter category consists of personnel who have retired from organisations whose budget is accounted for by the Defence Services Estimates (DSE), an annual publication of the MoD which for long was treated as India’s official defence budget. The key organisations that account for most of the defence civilian pensioners are the Ordnance Factory Board (OFB) and the Defence Research and Development Organisation (DRDO). Besides, several military organisations including the Military Engineer Services (MES), Army Ordnance Corps (AOC), Army Service Corps (ASC), naval dockyards, Base Repair Depots (BRD), Equipment Depots, army base workshops, etc., which employ a sizeable number of civilians, also contribute to the overall number of defence civilian pensioners.
It is worthwhile mentioning here that the number of defence pensioners as reported by the Standing Committee on Defence does not capture all the retirees on the MoD’s payroll. There is a sizeable number of pensioners who retired from various defence establishments but their pension is paid through the MoF’s civil pension budget. As of 2020, there are about 73,700 MoD civil pensioners, a majority of whom are retired employees of the Defence Accounts Department (DAD), Borders Roads Organisation (BRO), Jammu and Kashmir Light Infantry (JKLI) and the Coast Guard (CG). Suffice it to say that the non-pensionary expenses of these organisations are paid through the MoD’s civil estimate. In 2020-21, the budget for MoD civil pension amounts to Rs 5,114 crore, which includes about Rs 1,000 crore as the government’s contribution towards the National Pension System (NPS) for all civilian employees paid through the DSE and the MoD’s civil estimates.
The number of defence pensioners funded by both MoD and MoF adds up to nearly 33,09,430, which represents 51 per cent of the total number of central government pensioners (65,36,469).16 In terms of expenses, defence pensioners, including MoD civil pensioners, account for 51 per cent of the total central government pension budget in 2020-21.
Table 2 summarises the number of personnel in eight broad categories. The total numbers add up to 53,06,580, which is nearly 2,33,700 more than previous estimates of 50,72,880 as mentioned earlier.
|
Category (Year) |
No. | % of Total |
|
Uniformed Personnel (2019)
|
14,38,717 | 27 |
|
Defence Civilians (2017-18)
|
3,98,422 | 7.5 |
|
Defence Pensioners (2018-19)
|
32,35,730 | 61 |
|
MoD Civil Pensioners (DAD, JKLI, CG, BRO) (2020)
|
73,700 | 1.4 |
|
Defence Security Corps (2020)
|
62,200 | 1.2 |
|
Armed Forces Recruits under Training (2020)
|
74,575 | 1.4 |
|
NCs (E) of Indian Air Force (2020)
|
11,300 | 0.2 |
|
Medical, Dental and Nursing Officers (2018)
|
11,936 | 0.2 |
|
Total
|
53,06,580 | 100 |
Source: Compiled from “Demands for Grants (2019-20)”, SCOD (2019-20), 17th Lok Sabha, 2nd Report, December 2019; “Demands for Grants 2020-21”, SCOD, 17th Lok Sabha, 5th Report, March 2020, p. 156; and “Annual Report on Pay and Allowances of the Central Government Civilian Employees”, Department of Expenditure, Ministry of Finance, p. 47; and anonymous sources.
Distribution of Defence Civilian Manpower
While Table 2 provides aggregate personnel strength across eight categories, it does not reveal the distribution of manpower, especially in respect of defence civilians, scattered both within the armed forces and other defence establishments. Table 3 tries to partly fill this gap by mapping the distribution of civilian manpower across a number of organisations.
|
Category of Manpower (Year)
|
Sanctioned Strength (No) | Held Strength (No.) | Shortages (%) |
|
Civilians in air force (2020)
|
N.A. | 21,200 | --- |
|
Civilians in navy (2015-16)
|
46,826 | 37,888 | 19 |
|
Military Engineer Services (MES) (2017-18)
|
1,19,505 | 61,722 | 48 |
|
Corps of Electronics and Mechanical Engineers (EME)
|
18,403 | 14,261 | 23 |
|
Ordnance Factory Board (OFB) (2019-20)
|
1,45,503 | 80,524 | 45 |
|
Defence Research and Development Organisation (DRDO) (2018-19)
|
N.A | 24,732 | --- |
|
Directorate General Quality Assurance (DGQA) (2005)
|
18,567 | 13,435 | 28 |
|
Border Roads Organisation (BRO) (2018-19)
|
41,600 | 33,587 | 19 |
|
Defence Accounts Department (DAD) (2018-19)
|
29,994 | 19,109 | 36 |
|
Defence Estate Organisation (DEO) (2018-19)
|
1,270 | 824 | 35 |
|
Coast Guard Organisation (2018-19)
|
13,842 | 13,842 | 0 |
|
Armed Forces Headquarters (AFHQ) Cadre (2020)
|
11,352 | 8,190 | 28 |
|
Canteen Stores Department (CSD) (2018-19)
|
3,668 | 2,348 | 36 |
|
Armed Forces Tribunal (2018-19)
|
592 | 374 | 37 |
|
Department of Defence (Including Finance Division) (2018-19)
|
1,590 | 1,144 | 28 |
|
Department of Defence Production (2018-19)
|
162 | 139 | 14 |
|
Department of Defence Research and Development (2018-19)
|
21 | 18 | 14 |
|
Department of Ex-Servicemen Welfare (DESW) (2018-19)
|
68 | 45 | 34 |
|
Total
|
4,52,963 | 3,33,382 | --- |
Note. Information collated in the table is neither comprehensive nor up-to-date. Also, some manpower figures might be overlapping with uniformed personnel due to cross posting.
Source: Compiled from “Demands for Grants (2020-21)”, SCOD, 17th Lok Sabha, 5th Report, p. 153; “Demands for Grants (2020-21)”, SCOD, 17th Lok Sabha, 8th Report, p. 15; “Demands for Grants 2017-18”, SCOD, 16th Lok Sabha, 28th Report, p. 65; “Detailed Demands for Grants of Ministry of Defence for 2020-21”, Department of Expenditure, Ministry of Finance; “Demands for Grants 2016-17”, SCOD, 16th Lok Sabha, 20th Report, p. 43; “Manpower Planning in the Indian Army: An Empirical Study of Corps of Electronics and Mechanical Engineers”, Shodhganga, Chapter 1, p. 7; “Performance Audit of the Directorate General of Quality Assurance”, Comptroller and Auditor General (CAG) of India, Report No. 18 of 2005, p. 47; “Planning and Management of Refits of Indian Naval Ships”, CAG, Report No. 31 of 2013, p. 48; “Annual Report 2018-19”, Ministry of Defence, p. 95; and anonymous sources.
As can be seen from Tables 2 and 3, there is a difference between the numbers of defence civilians. This is primarily due to the omission from Table 3 of several army-related organisations because of the lack of availability of information in the public domain. Some of the organisations omitted in Table 3 include the ASC, AOC, Army Postal Service, etc. The omission notwithstanding, total civilians employed within the army are estimated at around 94,000.17 Adding this to the number of civilians of the navy and air force, the total number of civilians in the three services stands at about 1,53,000.
Defence Manpower Cost
The funding of the vast defence manpower comes at a significant cost. The major part of the funding comes through the MoD’s budget, while a small part is funded through the MoF. The cost is borne by the MoD/MoF in the form of P&A, pension and ration, medical, clothing, and housing benefits. In 2020-21, the total amount earmarked is more than Rs 3,08,000 crore. In terms of percentage of the total defence budget, the manpower cost amounts to 65 per cent (see Table 4).
|
Manpower Element
|
Amount (Rs in Crore) | % of Defence Budget^ |
|
P&A as Summarised in the DSE
|
1,53,910 | 32 |
|
Defence Pension (Paid through the MoD’s budget)
|
1,33,825 | 28 |
|
MoD Civil Pension (Paid through the MoF’s budget)
|
5,114 | 1.1 |
|
Salary of Coast Guard, DAD, BRO and JKLI* personnel
|
6,332 | 1.3 |
|
P&A of MES#
|
2,262 | 0.5 |
|
Provisions (fresh ration, dry ration, milk and milk products, etc)
|
4,000 | 0.8 |
|
Ex-Servicemen Contributory Healthy Scheme (ECHS)
|
3,000 | 0.6 |
|
Clothing**
|
356 | 0.1 |
|
Total
|
3,08,799 | 65 |
Note. ^: For the purpose of estimation, defence budget is taken as the sum of MoD’s budget (Rs 4,71,378 crore) and MoF’s civil pension budget earmarked for MoD civil pensioners (Rs 5,114 crore); #: Figure based on 20 per cent of revenue ‘Works’ budget of the three forces; *: Salary figure of JKLI is taken as 80 per cent of its total budget; **: Clothing expense taken as 50 per cent of total clothing expense so as to distinguish between combat clothing and personal clothing.
Source: Compiled from “Defence Services Estimates 2020-21”, Ministry of Defence; “Allocation of Budget Estimates 2020-21 under Grant No-37 Pensions”, Central Pension Accounting Office, Ministry of Finance; “Detailed Demands for Grants of Ministry of Defence for 2020-21”, Department of Expenditure, Ministry of Finance; and Laxman Kumar Behera & Madhulika Baniwal, “Bang for Buck: India’s Defence Expenditure in Wider Perspective”, MP-IDSA Special Feature, July 10, 2020.
Uniformed and Civilian P&A
Of the total P&A earmarked in the DSE 2020-21, nearly 85 per cent (or Rs 1,31,007 crore) is accounted for by the uniformed and civilian employees of the army, navy and air force.18 In the last two decades, there has been a distinct change in the share of civilians P&A: it has declined from 13 per cent to nine per cent (see Figure 2). Among the three services, the navy, which is the most civilian intensive service, has witnessed the most drastic decline from 40 to 29 per cent, followed by the air force (from 13 to nine per cent) and the army (from 10 to seven per cent).
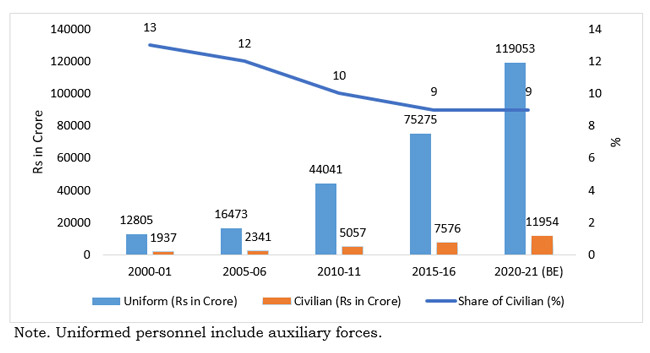
Source: Compiled from Defence Services Estimates (relevant years), Ministry of Defence, Government of India.
The fall in the share of civilian P&A is the result of a consistent increase in uniformed personnel and a sharp decline in 2001-02, near stagnation thereafter, of civilian employees (see Figure 1). Suffice it to say that the number of uniformed personnel has increased sharply during the last 50 years; from 9,58,049 in 1971 to 11,80,940 in 1995 to 14,38,717 in 2019. Between 2000-01 and 2017-18, the longest duration for which data are available, the number of defence civilians declined by 21 per cent.
The decline in the number of defence civilians does not, however, gel with the past recommendations in favour of civilianisation of several non-core functions of the armed forces. These recommendations were premised on the fact that civilians are less costly than uniformed personnel because the latter, unlike the former, are entitled to military service pay (MSP), ration and clothing allowances, and, more importantly, pension.19 Suffice it to say that the Fifth Central Pay Commission (CPC) in its report had mapped out several organisations where deployed uniformed personnel could be replaced by civilians.
Some of the organisations identified by the Commission for civilianisation include the ASC, DGQA, MES, BRO, Accounts branch of the air force, Resettlement Wing, CSD and Survey of India, among others. Further, the Commission had suggested, as a matter of governing principle, that “wherever the existing civilian-combatant ratio is 20:80 it should be raised to 50:50, where it is 70:30 to 80:20 and where the civilian component is 100 per cent, the status quo should be maintained.”20 Considering that the armed forces face shortages of personnel to perform key operational tasks, it is imperative for the government to civilianise the non-core functions of the armed forces and divert combatants to perform the tasks they are best at.
Distribution of P&A of Uniformed Personnel
Of the total P&A of the army, navy and air force, the uniformed personnel account for about 90 per cent (or Rs 1,17,309 crore) in 2020-21.21 The uniformed personnel’s P&A is distributed among a number of sub-budgetary heads. However, the sub-budgetary heads do not offer an easy template to estimate the crucial teeth-to-tail ratio, making it difficult to assess how much resource the government spends on personnel engaged in support services in order to support combatants. Besides, there is no commonality of sub-budgetary heads among the services.22 Among the three services, the navy has, however, a better system of capturing P&A of the uniformed personnel. Its sub-budgetary heads offer clarity as to how much the navy spends on personnel deployed in headquarters, ships/establishments, repair and maintenance organisation, DSC, besides expenses on items such as leave travel concession (LTC) and medical, among others.23 Such a template, with suitable modifications, should be adopted by the other two services to facilitate meaningful analysis of the personnel expenditure.
Summing Up
As demonstrated above, the MoD’s manpower base is significantly higher than what has otherwise been known in the public domain so far. Total defence manpower – including medical professionals, personnel deployed in the DSC, military recruits undergoing training, and MoD civil pensioners paid out of the MoF’s budget – add up to 53,06,580, which is nearly 2,33,700 more than previously estimated. Total defence manpower represents 47 per cent of the central government’s total salaried persons and pensioners. About 62 per cent of defence manpower, however, consists of retired personnel, a majority of whom are military pensioners and their dependents.
Such a large defence manpower base has obviously come at a significant cost, adversely affecting the modernisation of defence forces, serviceability of existing weapons and technological advancement. Rationalisation of manpower, including by way of civilianising the non-core functions of the armed forces as suggested by the Fifth Pay Commission, therefore, is key to the long-term sustainability of India’s defence preparedness.
However, any manpower reform has to begin with knowing the numbers, their deployment in various organisations and the types of retirees. For this, the MoD needs to map the entire manpower, both serving and retired. This is not an unsurmountable job considering the computerisation of pay and pension records. A comprehensive and up-to-date database would facilitate an easy understanding and greater analysis of defence manpower and its costs. Like other democracies, India may also like to maintain a detailed time-series statistics of defence manpower as part of its annual budgetary documents.
The authors gratefully acknowledge the vital inputs provided by the various government authorities for this study.
Views expressed are of the authors' and do not necessarily reflect the views of the Mahonar Parrikar IDSA or of the Government of India.
- 1. As of March 2018, there were 31,80,100 regular Central Government employees in position (against a sanctioned strength of 38,66,691), of which 12,48,325 employees were in Railways and 9,48,266 in Home Affairs. In 2017-18, the MoD’s personnel strength was 18,42,343, of which 14,43,921 were uniformed personnel and 3,98,422 were defence civilians. See “Annual Report on Pay and Allowances of the Central Government Civilian Employees 2017-18”, Department of Expenditure, Ministry of Finance, Government of India; “Demands for Grants 2018-19”, Standing Committee on Defence (SCOD) (2017-18), 17th Lok Sabha, 40th Report, Para 1.29, Lok Sabha Secretariat, March 2018.
- 2. See Laxman Kumar Behera, “India’s Defence Budget 2020-21”, MP-IDSA Issue Brief, February 04, 2020.
- 3. Ibid.
- 4. Amrita Nayak Dutta, “Make short service lucrative, raise retirement age: CDS plan to reduce defence pensions”, The Print, April 30, 2020. For a discussion on defence pension, see Laxman Kumar Behera, Vinay Kaushal and Amit Cowshish, “Defence Pension: A Comparative Study of India, US and UK”, MP-IDSA Policy Brief, April 23, 2020; and Laxman Kumar Behera and Vinay Kaushal, “Defence Pension Reforms: Recommendations of the Past Committees and Commissions”, MP-IDSA Special Feature, February 28, 2020.
- 5. For a comprehensive review of the impact of manpower cost on other elements of India’s defence expenditure, see Laxman Kumar Behera and Madhulika Baniwal, “Bang for Buck: India’s Defence Expenditure in Wider Perspective”, MP-IDSA Special Feature, July 10, 2020.
- 6. See Table 7-5 in “National Defense Budget Estimates for FY 2021”, Office of the Under Secretary of Defense (Comptroller), April 2020, pp. 285-88. In FY 2021, the US DoD has a total manpower of 2.248 million, of which 64 per cent or 1.442 million are in active duty military and 36 per cent or 0.806 million are civilians.
- 7. As of FY 2018, the US has 20,01,343 retirees receiving retired pay. See “Statistical Report on the Military Retirement System: Fiscal Year Ended September 30, 2018”, Office of the Actuary, US Department of Defence, May 2019, pp. 16-17.
- 8. See “Expenditure Tables: Data for 1996-2019”, US Department of Veterans Affairs.
- 9. See “Excel tables to UK armed forces quarterly service personnel statistics: 1 April 2020”, UK Ministry of Defence, June 04, 2020.
- 10. See “War Pension Scheme annual statistics: 1 April 2009 to 31 March 2019”, UK Ministry of Defence, June 27, 2019.
- 11. See “Armed Forces Pension Scheme (Incorporating the Armed Forces Compensation Scheme): Annual Accounts 2018-19”, UK House of Commons, July 2019.
- 12. See “Annual Report on Pay and Allowances”, Department of Expenditure, Ministry of Finance, Government of India.
- 13. “Annual Report on Pay and Allowances of the Central Government Civilian Employees 2017-18”, no. 1, p. 47.
- 14. “Human Resource Planning, Shortage of Manpower, Infusion of Hi-Tech Training and Infrastructure for the Armed Forces”, SCOD (2008-2009), 14th Lok Sabha, 34th Report, Lok Sabha Secretariat, February 2009, pp. 9-11.
- 15. The personnel of the DSC are subject to Army Act and are responsible for providing security to the defence installations of the armed forces and other civilian defence establishments. See “Defence Security Corps”, Indian Army, Government of India.
- 16. For the total number of Central Government pensioners, see “Performance Dashboard: Central Government Pensioners as on 31.03.2019”, Department of Pension & Pensioners' Welfare, Ministry of Personnel, Public Grievances & Pensions, Government of India.
- 17. Army’s civilian strength is based on extrapolation of Indian air force’s 2020-21 civilian manpower number (of around 21,200) and its P&A (of Rs 1,627 crore). By applying the average P&A of an air force civilian employee to that of the army, the latter’s civilian strength in 2020-21 is estimated at 94,238.
- 18. The remaining 15 per cent is distributed among OFB (five per cent), Rashtriya Rifles (four per cent), DRDO (three per cent), Joint Staff (two per cent), and DGQA, National Cadet Corps (NCC), Military Farms and ECHS (one per cent).
- 19. Since January 2004, all new entrants to the government service are covered under the NPS, a contributory pension scheme under which the employee contributes towards his/her pension with a matching contribution from the government. See “Streamlining National Pension System”, Press Information Bureau, Government of India, December 10, 2018.
- 20. “Report of the Fifth Central Pay Commission, Vol. I”, Ministry of Finance, Government of India, pp. 301-302.
- 21. The P&A of the uniformed personnel of the three forces are captured through the Minor Head 101 of Major Heads 2076 (Army revenue), 2077 (Navy revenue) and 2078 (Air Force revenue).
- 22. In the case of Army, the sub-heads include P&A of Officers, P&A of Other Ranks, P&A of Recruits, LTC and Medical Treatment. The corresponding heads of the air force are: P&A of Officers (flying, technical and non-technical), P&A of Flight Cadets (flying, technical and non-technical), P&A of airmen (technical and non-technical), P&A of NC (E), LTC and Medical Treatment.
- 23. In 2020-21, of the total P&A (Rs 7,428 crore) of the uniform personnel of the navy, the share of officers was 30 per cent. Total P&A of officers is distributed into a number of heads that include Establishments and Units other than Ships/Training Ships (25 per cent of total P&A of officers), Ships (other than Training Ships) (22 per cent), Naval Headquarters (13 per cent), Training Ships/Establishments (10 per cent), Repair and Material organisations (13 per cent), and others (17 per cent). Based on the navy’s P&A of officers deployed at headquarters, the authors estimate that nearly 6,500 officers of the three armed forces are deployed at the service headquarters. If officers posted in the National Capital Region (NCR) are taken into consideration, the total number would be much higher.
| Attachment | Size |
|---|---|
| 290.81 KB |