You are here
Defence Budget 2019-20: The Slide Continues

The public discourse in the recent past has been focussed on one particular defence acquisition and speculation as to the reasons why the number originally decided was changed. As a result, what has become lost sight of is the single most important constraint confronting the armed forces, namely, the defence budget. Defence expenditure as a percentage of the Gross Domestic Product (GDP) has been declining steadily during the last several years. In the interim budget for 2019-20 presented to Parliament on February 1, this trend continues. (See Chart 1).
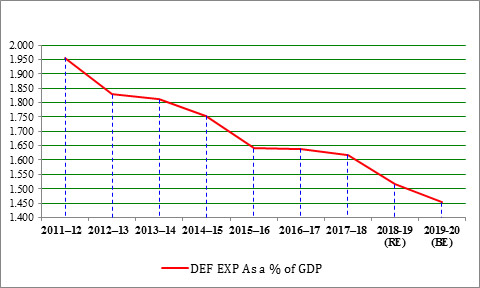
Chart 1 retains the consistency of what is recognised as defence expenditure, notwithstanding rationalisation in the demands in Budget 2016-17 and some reversals in 2017-18. It does not mean that the absolute amount allocated has been reducing, only that the increase has not kept pace with the growth rate of economic activity (see Table 2). As mentioned by the Finance Minister in his speech, the defence budget will be crossing the Rs 300,000 crore mark for the first time.
| Year | Defence Expenditure | GDP |
| 2011–12 |
170913 |
8736329 |
| 2019-20 (BE) |
305296 |
21007439 |
| Percentage Growth over the Period |
78.63 |
140.46 |
But this increase in the absolute amount of allocations has not resulted in an increase in the purchasing power of the resources for three main reasons. Firstly, changes in the exchange rate of the rupee influences the purchasing power of the capital budget whether the acquisitions of weapons and equipment are made from external sources, which have to be paid for in foreign exchange), or Defence Public Sector Undertakings (DPSUs), which import the material required for producing defence use items, or even private sector companies which have to be reimbursed for Exchange Rate Variation (ERV) between the time a contract was signed and the time when they procure the material from foreign sources). Further, a major part of the non-salary portion of the revenue budget, i.e., stores and fuel, is also impacted by the exchange rate for the same reasons mentioned above with respect to the capital budget. Table 1 below indicates in percentage terms the year-on-year increases in the defence budget as well as the variation in percentage of the annual average exchange rate of the US Dollar.
|
|
||||||||
| 2012-13 | 2013-14 | 2014-15 | 2015-16 | 2016-17 | 2017-18 | 2018-19 (RE) | 2019-20 (BE) | |
| Defence Revenue | 8.02 | 11.77 | 10.00 | 6.67 | 13.34 | 12.53 | 2.85 | 5.47 |
| Defence Capital | 3.82 | 12.24 | 3.49 | -2.36 | 8.02 | 4.72 | 3.92 | 10.00 |
| Total | 6.36 | 11.95 | 7.47 | 3.29 | 11.46 | 9.85 | 3.20 | 6.96 |
| Dollar Rupee exchange rate | 13.54 | 11.20 | 1.06 | 7.07 | 2.45 | -3.90 | 8.30 | |
Secondly, during 2016-17 and 2017-18, the arrears of the 7th Central Pay Commission were disbursed and had to be absorbed within the allocated budget. Hence in real terms the purchasing power of the resources available for building and sustaining defence capability has been reducing every successive year.
| 2015-16 | 2019-20 (BE) | |
| Defence Revenue Expenditure |
145936 |
201902 |
| P&A - Army, Navy & Air Force |
82828 |
121252 |
| Percentage |
56.76 |
60.05 |
The third factor that has contributed to reducing the purchasing power of the funds allocated for defence is actually an outcome of the policy changes effected to incentivise Make in India. In 2015-16, with a view providing a level playing field to the domestic private sector vis-à-vis public sector defence entities, the government withdrew the excise duty exemptions that were until then made available to the Ordnance Factory Board (OFB) and DPSUs, as well as the exemptions from countervailing duty (CVD) and special additional duty (SAD) that were until then permitted for DPSUs, OFB and primary contractors of the Ministry of Defence.
Consequently, excise duty at the rate of 12.5 per cent became chargeable on spares parts; and the impact of customs duty was 18.50 to 29.74 per cent on the material cost component. The exemption from customs duty of direct imports by the MoD was also withdrawn through the Finance Bill, 2016-17, and basic customs duty (BCD) of 5 to 10 per cent, CVD of 12.5 per cent and SAD of four per cent began to be levied from 1 April 2016. The impact of this too would be in the range of 18.50 to 29.74 per cent. The result of all this was that the sale price of supplies ex-DPSUs and OFB went up in 2015-16 and the price of direct imports also went up from 2016-17. This placed a substantial additional financial burden on the scarce capital budget. It also impacted the revenue budget. In addition, the implementation of the Goods and Services Tax (GST) has increased the service tax on defence-related items repaired or overhauled by DPSUs and OFB to 18 per cent, an increase of six per cent over the previous rate. In effect, well-meaning policy changes have increased prices over and above inflation and placed additional pressure on the allocated resources.
Conventionally, a country’s defence expenditure is seen as a percentage of GDP. The primary reason for using GDP as the denominator is that it has a consistent definition followed by all countries, international financial institutions as well as the United Nations. Even the North Atlantic Treaty Organization (NATO) countries, which, with the exception of new members like Ukraine, have no physical threat to their territorial integrity, and despite the United States’ (US) assurances, feel the need to spend two per cent of their GDP on defence. Some experts argue that defence expenditure as a percentage of GDP is not the right measure since GDP does not mean resources available with the Government and, therefore, the relationship between defence expenditure and central government expenditure would be a better indicator. Others argue that Defence Pensions need to be included in addition to what is traditionally regarded as defence expenditure. Table 5 below addresses these reservations.
| Head |
ACTUAL EXPENDITURE AS PER ACCOUNTS AT A GLANCE OF CGA MoF |
BUDGET 2019-20 |
||||||
| Defence Expenditure | 2012-13 | 2013-14 | 2014-15 | 2015-16 | 2016-17 | 2017-18 | 2018-19 (RE) | 2019-20 (BE) |
| Revenue | 111277 | 124374 | 136807 | 145936 | 165410 | 186129 | 191431 | 201902 |
| Capital | 70499 | 79125 | 81887 | 79958 | 86371 | 90445 | 93992 | 103394 |
| Total | 181776 | 203499 | 218694 | 225894 | 251781 | 276574 | 285423 | 305296 |
| Total expenditure of GOI | ||||||||
| Revenue | 1243513 | 1371772 | 1466992 | 1537761 | 1692986 | 1878835 | 2140612 | 2447907 |
| Capital | 166858 | 187675 | 196681 | 253022 | 286282 | 263140 | 316623 | 336293 |
| Total | 1410371 | 1559447 | 1663673 | 1790783 | 1979268 | 2141975 | 2457235 | 2784200 |
| Defence Capital Expenditure as a % of total Govt Capital Expenditure | 42.25 | 42.16 | 41.63 | 31.6 | 30.17 | 34.37 | 29.69 | 30.75 |
| Defence Expenditure as % of total Government Expenditure | 12.89 | 13.05 | 13.15 | 12.61 | 12.72 | 12.91 | 11.62 | 10.97 |
| Defence Pension | 43368 | 45500 | 60450 | 60238 | 87826 | 92000 | 106775 | 112080 |
| Defence Pension as % of Govt expenditure | 3.07 | 2.92 | 3.63 | 3.36 | 4.44 | 4.30 | 4.35 | 4.03 |
| Total | 15.96 | 15.97 | 16.78 | 15.98 | 17.16 | 17.21 | 15.96 | 14.99 |
The continuing slide in defence allocations puts a strain on sustaining and building the capability of the armed forces. Resource constraints are a challenge and opportunity for the MoD and the Defence Services to urgently initiate reforms – structural, procedural and administrative – to optimise expenditure and apportion a greater portion of the resources allocated for capability building (capital budget) and capability sustenance (operations and maintenance expenditure).
Views expressed are of the author and do not necessarily reflect the views of the IDSA or of the Government of India.